Table of Contents
Performance Optimisation is not a matter of replacing all your double quotes with single quotes and praying a few saved nanoseconds will prevent Apache from biting into swap space, and setting fire to your server, when you're listed on Digg. Rather it's a deliberate process of setting performance goals, benchmarking to measure current performance, identifying inefficiencies and bottlenecks, purchasing appropriate server hardware and being agressive in trying new tactics that never occured to you. In other words, it's a lot of fun!
In this appendix, I discuss performance optimisation in terms of the various approaches and tactics commonly used in the real world - where we don't really worry about stuff like double quotes (unless it has a perceptible effect). Most of these should become familiar friends if they are not already.
Since detailing performance options is a large task, this is a large Appendix but hopefully it will come in handy. I am not going to limit this appendix to just the Zend Framework and a lot of this appendix applies to any PHP application.
Before we do anything, let's be very clear that you shouldn't sacrifice a sound application design on the altar of premature optimisation. Premature optimisation is, as Sr. Tony Hoare originally put it, the root of all evil. Let's not take it out of context however! To forever put off optimisation, is to never obtain an efficient application. Eventually, the temptation must become overwhelming but timing is everything. Optimising too early can lead to a restrictive design that only causes more problems, so it's worth waiting until the application is in a state fit to be optimised.
Optimisation is a game of eliminating measurable inefficiencies. The keyword is "measurable". If you can't reliably measure or predict the impact of an optimisation, then how do you know it's a worthwhile optimisation? A silly replacement of a few double quotes with single quotes taking one developer hour to complete might gain you a completely unnoticeable performance boost. You just wasted an hour and gained little or nothing worth bragging about! Meanwhile there's a slow SQL statement which, with caching applied from a few minutes work using Zend_Cache, gains you a whole second. Obviously the second option is far more worthy of attention. Focus your efforts on optimisations that achieve the greatest benefit.
There are three approaches to optimisation: following your blind beliefs, following your experienced intuition, and employing software tools to analyse applications for optimisation opportunities. The third is the only real valid option. The others are uncertain and you risk leaving valuable optimisations undiscovered, or wasting your time on pointless ones. That doesn't invalidate the first two entirely but they are often the category of optimisations any reasonable programmer should apply throughout development - not areas that should need hours of attention after the fact.
An experienced programmer will rarely create a hideously inefficient application littered with obvious source code failings. Some element of optimised performance will already be present in the existing design so what remains is to push things further in a deliberate considered fashion. A lot of optimisations are common sense, since once you understand the problem there are only so many solutions to choose from, and most of those will have been blogged by half the planet.
Optimisation is only working if you can create significant measurable results. Significance is relative of course, one programmer's saved millisecond can be another's shaved off second. As you optimise the most obvious performance issues, lesser issues will begin coming to the fore until you reach a state where optimising further carries a higher cost than the end benefit or the alternative of simply throwing in more hardware. In any case, you should have a target performance in mind and to reach that target requires measuring current performance to set a baseline, and future performance to measure if you've accomplished any worthwhile improvements over that baseline.
Performance measurement is generally concerned with a few metrics. Memory and CPU usage are the obvious ones, especially on a single server where resources are limited. But even in an environment where you are scaling your hardware either vertically or horizontally, maximising performance can save you from needlessly splashing out on expensive servers to cover up the holes in sub-optimal code. Another common measure alongside these is requests per second, a measurement of how many requests some part of your application is capable of serving per second given the current hardware it's hosted on.
Measuring memory consumption can be done at both the server and PHP levels. PHP supports two useful functions which measure how much memory PHP is consuming. memory_get_usage() and memory_get_peak_usage() can be called to determine how many bytes are consumed either at a specific point in the PHP workflow, or at it's peak. These are typically used to get some rough estimates of the memory profile of an application - determining where in the application memory is peaking beyond an acceptable tolerance level. Determining that tolerance level is no easy task since some features naturally need more memory than others. There's a reason your php.ini file has fairly high memory limits!
One useful tactic is a nod to the futility of attempting manual measurement. Instead of clicking every possible link and submitting every possible form by hand, simply set up one or more points in the source code where measurement can take place. Whether you do this using software tools to automatically attack all routes (functional testing might be a place to start if employed), or by slapping a beta sticker on a production site and letting it run live for a short period is up to you.
One possible rough solution is to write a small Controller Plugin which implements the Zend_Controller_Plugin_Abstract::dispatchLoopShutdown() method.
<?phpclass ZFExt_Controller_Plugin_MemoryPeakUsageLogextends Zend_Controller_Plugin_Abstract{protected $_log = null;public function __construct(Zend_Log $log){$this->_log = $log;}public function dispatchLoopShutdown(){$peakUsage = memory_get_peak_usage(true);$url = $this->getRequest()->getRequestUri();$this->_log->info($peakUsage . ' bytes ' . $url);}}
You can register this from your Bootstrap when you want to use it.
<?phpclass ZFExt_Bootstrap{// ...public function enableMemoryUsageLogging(){$writer = new Zend_Log_Writer_Stream(self::$root . '/logs/memory_usage/index.html');$log = new Zend_Log($writer);$plugin = new ZFExt_Controller_Plugin_MemoryPeakUsageLog($log);/*** Use a high stack index to delay execution until other* plugins are finished, and their memory can also be accounted* for.*/self::$frontController->registerPlugin($plugin, 100);}// ...}
This is a fairly basic example, and you could easily adapt something similar to log additional information about the original request, so you have enough data to reperform the request in a more controlled environment to pinpoint the reason for any memory sinks. Here's some output from the log setup above.
2009-01-09T15:41:46+00:00 INFO (6): 4102728 bytes /
2009-01-09T15:42:57+00:00 INFO (6): 4103608 bytes /index/comments
If you prefer to watch memory usage on the fly, you can use a different PHP stream for the Writer strategy or even use the Firebug Writer to watch the live results when using Firefox with FirePHP.
Once you have a rough memory profile, you might then use a systematic approach like Code Profiling to gather detail on the root causes of any memory usage. Code Profiling is also a good way to see where execution time is being spent.
Apart from solutions built into the application, you can also monitor memory and CPU usage on the server an application is running on using a variety of tools. Linux systems offer top, free, vmstat and a variety of others. A personal favourite is htop which displays a continually update summary of memory, CPU and per-process data with a few interactive features for ordering processes by various statistics.
These are of particular use in tuning servers to cater to your application, but obviously they also can assist in seeing how your application performs on a pre-optimised test server during load testing - how much memory are the Apache processes consuming, can I run more or fewer Apache clients, which application areas are maxing out the CPU rather than RAM?
Load testing is another useful performance measurement tool. It is influenced to a significant degree by the hardware tests are performed on, so to maintain comparable results over time you'll need a test system whose specifications and general load profile remain constant. Its purpose is to measure how many requests your application (a specific URL, or set of URLs) can complete per second on average. The time taken is of lesser concern (changes with the hardware) so it's the relative drift in the measure over time that indicates whether your application is becoming more or less performant. You'll notice that most framework benchmarks tend to obsess over this value.
The approach, simply enough, is to simulate the effect of being hit by a specific number of requests spread across a given number of concurrent users. Sometimes the base element is a period of time instead of a fixed number of requests. The total number of requests served is then divided by the time in seconds taken to complete this number of requests. It's extremely effective in noting how application performance changes as you optimise the application and/or the server it's hosted on.
Two commonly used tools for this purpose are ApacheBench (ab) and Siege.
The ApacheBench tool is normally installed along with the HTTP server binaries. If it's missing, sometimes you might need to install an Apache Utils package. Under Ubuntu it's usually located at /usr/sbin/ab which may not be listed in Ubuntu's PATH by default, which means you should either add /usr/sbin to your current user's PATH or call it using its absolute path.
Here's the ApacheBench command to run 10,000 requests across 100 simulated concurrent users (the ending slash is important in naked URIs):
ab -n 10000 -c 100 http://www.survivethedeepend.com/
The resulting output will look similar to this:
Server Software:        apache2
Server Hostname:        www.survivethedeepend.com
Server Port:            80

Document Path:          /
Document Length:        9929 bytes

Concurrency Level:      100
Time taken for tests:   341.355 seconds
Complete requests:      10000
Failed requests:        0
Write errors:           0
Total transferred:      101160000 bytes
HTML transferred:       99290000 bytes
Requests per second:    29.29 [#/sec] (mean)
Time per request:       3413.555 [ms] (mean)
Time per request:       34.136 [ms] (mean, across all concurrent requests)
Transfer rate:          289.40 [Kbytes/sec] received

Connection Times (ms)
              min  mean[+/-sd] median   max
Connect:        0    0   1.7      0      52
Processing:   124 3409 831.1   3312   10745
Waiting:      120 3267 818.5   3168   10745
Total:        124 3409 831.1   3312   10745

Percentage of the requests served within a certain time (ms)
  50%   3312
  66%   3592
  75%   3784
  80%   3924
  90%   4344
  95%   4828
  98%   5576
  99%   6284
 100%  10745 (longest request)
Here's a similar example for Siege where you set total requests by setting a number of concurrent users with a repeat factor for each one. So 100 concurrent users repeating requests 10 times gives you 1,000 total requests. The additional option sets a delay of 1 second between concurrent users which is good enough for performance testing.
siege -c 100 -r 10 -d 1 http://www.survivethedeepend.com
The results are a bit shorter but still show the requests per second as "Transaction rate":
Transactions:                   1000 hits
Availability:                 100.00 %
Elapsed time:                  43.77 secs
Data transferred:               3.06 MB
Response time:                  3.20 secs
Transaction rate:              22.85 trans/sec
Throughput:                     0.07 MB/sec
Concurrency:                   73.08
Successful transactions:        1000
Failed transactions:               0
Longest transaction:            8.78
Shortest transaction:           0.05
Both load testing options come with a variety of other options worth investigating. When you're looking at the server come deployment time, mixing similar tests with the monitoring of your server's resources like memory and CPU can be pretty informative and useful when optimising Apache's configuration.
And yes, the performance of the book website when I ran those load tests was abysmal! If I was caching the pages properly at the time the request times would have significantly higher.
It should be noted that load testing takes both software and hardware into account and therefore it's a useful tool for server optimisation in addition to application performance measurement.
Rather than randomly picking pieces of source code to optimise and keeping your fingers crossed for good luck, here are a few methods of actually identifying specific performance problems.
Looking at the bigger picture by performing load testing and resource monitoring will get you some rudimentary data on which parts of the application perform worse or better than average. However, if you find a performance issue, the only definitive way you can locate the root cause is to break down that part of the application's performance across the entire source code execution stack. In a simple application, reading the source might work but a complex application could be spinning through database operations, file processing, or countless other possible tasks which effect performance. Bearing in mind your application may also be relying on third party libraries, reading the source isn't as easy as it sounds.
Code Profiling or Method Timing is a means of breaking down a single request so you can examine the execution time and memory usage of every function or method call performed for that request. It's invaluable in diagnosing performance problems and identifying targets for optimisation.
One common PHP profiler is the Xdebug extension maintained by Derick Rethans. Xdebug provides features for debugging, profiling and code coverage analysis. The profiling feature generates cachegrind compatible files which can be analysed into readable data by any cachegrind compatible application such as KCacheGrind (KDE), WinCacheGrind (Win32) or the web application, WebGrind.
Depending on the cachegrind application you choose, it will provide a few methods of seeing how much time was spent within every function, method and keyword statement. Obviously those with the greatest time or memory cost bear the closest examination to see if they can be optimised to gain worthwhile improvements.
The current version is available from PECL, and you can install it with a simple:
pecl install xdebug
The command will download and compile Xdebug. If you are on Windows, precompiled binaries are available for download from the Xdebug website's download page.
To finish installation we can configure Xdebug for profiling by adding the following to your php.ini file, and taking care to replace or comment out any previous line using the zend_extension or zend_extension_ts configuration option. Here's an example configuration added to a Ubuntu system at /etc/php/conf.d/xdebug.ini (Ubuntu allows for extension specific ini files outside of /etc/php5/apache2/php.ini).
; Xdebug
zend_extension = /usr/lib/php5/20060613/xdebug.so
;xdebug.profiler_enable = 1
xdebug.profiler_output_dir = "/tmp/index.html"
xdebug.profiler_output_name = "cachegrind.out.%t.%p"
Whenever you want to start profiling, remove the leading semi-colon from the xdebug.profiler_enable configuration line. Put it back when you're finished unless you like having gigantic cachegrind files taking over your hard disk. Here's some example output showing the percentage of execution time per function/method from Webgrind on a Windows system.
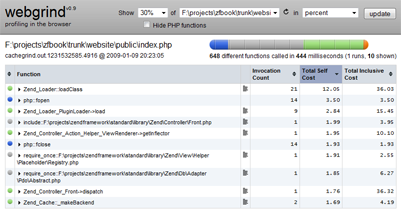
Cachgrind analysis output from Webgrind
Installing Webgrind just requires copying the download to your document root for Apache and editing the config.php file to remove the $storageDir and $storageProfiler options (the above xdebug ini configuration is enough to let Webgrind detect these automatically). Using the above configuration with xdebug.profiler_output_name should be sufficient to let to find any cachegrind output from Xdebug.
By employing code profiling, and generating cachegrind files for a variety of application URIs, we can now peer into the source code to find out who's being naughty and spending the most time to execute. As you'll notice from above, Zend_Loader seems to be having a ball making up almost 25% of the index page's execution time. Obviously, 25% is significant enough to warrant attention!
Xdebug will break down code execution but there are additional alternatives or complementary practices to assist in locating optimisation opportunities. One of the most obvious targets is the database.
Connecting to a database carries a few issues. First and foremost, database operations are innately expensive. Your application will need to open a connection to the database server, send the query, wait for the database to process the query, read back the result, do some more exciting tasks, and really...it's just messy! In any web application, the database will be a major bottleneck tying up a lot of your execution time.
Optimisation benefits can be gained from examining the method of utilising the database which in the case of Zend Framework will include Zend_Db_Table and your Models, along with the complexity and processing needs of SQL statements and the size of result sets being retrieved from the database.
In almost all three cases, where these are obvious and measured optimisation targets, caching is one strategy likely to have a benefit where the retrieved data changes infrequently and where the data itself is a large result set or is the result of a known slow query. Why continually bombard the database for data which only changes every few hours, days or even weeks? Cache it! Caching in memory using APC or memcached would obviously be preferably, but a file cache will do if memory resources are tight. Set an appropriate expiry period or manually clear the cached data whenever it changes. Zend_Cache makes organising this a walk in the park. Here's an example using a simple Comments Model where the cache configuration is managed from the main config.ini file of the application.
[general]
; SQL Query Cache
cache.sql.frontend.name=Core
cache.sql.frontend.options.lifetime=7200
cache.sql.frontend.options.automatic_serialization=true
cache.sql.backend.name=File
cache.sql.backend.options.cache_dir=/cache/sql
<?phpclass Comments extends Zend_Db_Table{protected $_name = 'comments';protected $_cache = null;public function init() {/*** config.ini general sections stored into Zend_Registry* Ideally the static calls would be replaced with dependency* injection*/$options = Zend_Registry::get('configuration')->cache->sql;$options->backend->options->cache_dir =ZFExt_Bootstrap::$root . $options->backend->options->cache_dir;$this->_cache = Zend_Cache::factory($options->frontend->name,$options->backend->name,$options->frontend->options->toArray(),$options->backend->options->toArray());}public function getComments($id){// pull data from cache, or else hit database and cache resultsif (!$result = $this->_cache->load('ENTRY_COMMENTS_' . $id)) {$select = $this->select()->where('entry_id = ?',$id)->where('status = ?','approved')->where('type = ?','comment')->order('date ASC');$result = $this->fetchAll($select);$this->_cache->save($result, 'ENTRY_COMMENTS_' . $id);}return $result;}public function insert($data) {// invalidate existing cache when saving new comments$this->_cache->remove('ENTRY_COMMENTS_' . $data['entry_id']);return parent::insert($data);}}
Where data changes all the time, a common situation where content is dynamic, user generated or based on user preferences, caching will have little benefit. The cache may become invalid even before Zend_Cache finishes writing it! In this scenario you will need to examine whether replacing any use of Zend_Db_Table with more direct SQL, or whether redesigning the SQL itself to increase its performance, has a perceptible effect. Where this conspires with a large result set, be careful that the only data being retrieved is required data. There's no point requesting additional fields if they are never used since all they'll do is consume memory needlessly and contribute to starving your server of precious RAM.
One area you can pay particular attention to, as an example, is the MySQL Slow Query Log. This feature let's you define the number of execution seconds, using the configuration option long_query_time, above which a query can be defined as being slow. All slow queries can then be logged for further examination. Since slow queries are measured in real time, it's worth noting that load testing an application will increase the detection rate as CPU and memory resources are strained. Use a lower long_query_time value if you are relying on a log generated on a development machine.
The Zend Framework offers its own logging solution for all SQL queries to profile what is run, and how long it takes to execute, using Zend_Db_Profiler. The profiler can be enabled by passing an option called "profiler" with a boolean TRUE value with the options when constructing a database adapter. Thereafter you can instantiate the Zend_Db_Profiler class and use a variety of methods to examine how many queries were profiled, how long they took in total to execute, and retrieve an array of query profiles on which to perform a more in-depth analysis using the accompanying filters. There's even a special Zend_Db_Profiler_Firebug class so you can view profiling data on the fly through the Firebug console in Firefox.
PHP has a number of well known, and not so well known, optimisations that are now regarded as standard practice. A few of these have become more prominent during the lifetime of PHP 5.2.
Using an opcode cache, like the Alternative PHP Cache (APC) extension, can have a significant impact on the performance of any PHP application by caching the intermediate code that results from parsing PHP source code. Skipping this level of processing and reusing the optimised cache in subsequent requests saves on memory and improves execution times. It should be standard practice to get this installed unless you are stuck on a limited shared host.
Installing APC is a relatively simple process using pecl. Under Linux, use:
pecl install apc
Windows users can download a precompiled DLL from http://pecl4win.php.net.
The final step is adding the APC configuration to your php.ini file, or by creating a new apc.ini file for APC under the typical Ubuntu setup in /etc/php5/conf.d/apc.ini.
;APC
extension=apc.so
apc.shm_size = 50
The configuration you use can have additional effects on performance and I suggest reading the documentation at http://php.net/manual/en/apc.configuration.php. Pay particular attention to apc.shm_size, apc.slam_defense (or apc.write_lock), apc.stat and apc.include_once_override. You should ensure apc.shm_size is, at a minimum, set to a sufficient level to cache all the classes used by your application (and whatever else you're hosting!). Also bear in mind anything you're putting in there via Zend_Cache or the apc functions.
One of the more recent innovations entered into the php.ini file for configuration is a realpath cache that debuted with PHP 5.2.0. This was designed to cache the realpath values of relative paths used in include_once and require_once statements. In the bad old days, every time you called require_once with a relative path sparked a set of file operations to find the file being referred to. Now it's done once, and cached using the configured TTL for future lookups.
The relevant settings are realpath_cache_size and realpath_cache_ttl. The first sets the size of the cache and defaults to 16K. Obviously this is not a huge number and should be increased somewhat to cater to applications loading up lots of files. The TTL value depends on how often files location are changing. If rarely, consider increasing this value from the default of 120 seconds. I've pushed this up a lot more than a few minutes without ill effect, but I'd be wary of it when moving lots of files around.
We've covered a lot of ground so far in general terms. The Zend Framework, as a target for optimisation, does have room for improvement. Being a backwards compatible framework, some optimisations are omitted in the current version to maintain backwards compatibility and support a minimum PHP version.
That doesn't mean we should walk away and do nothing!
Due to the way the Zend Framework is structured, the source code is littered with countless require_once statements. While this might not seem like a huge deal, given the size of the framework it usually results in having lots of unnecessary files being loaded up, parsed and readied for action - but they are never utilised.
Streamlining the number of classes being loaded may offer a modest benefit. This is achieved by making use of PHP's autoload capability which dynamically loads classes on demand (basically it's somewhat akin to lazy loading). Skipping the unnecessary classes from being included reduces PHP's workload.
With the Zend Framework, there is a slight complication in that the most commonly used autoload feature is provided by Zend_Loader. Zend_Loader has its own mysterious hidden agenda which requires that it performs independent file checks and other operations on all autoloads. These are, outside of any marginal edge cases, completely extraneous and pointless.
As of Zend Framework 1.8.0, Zend_Loader::autoload() has become a deprecated feature meaning you should not use it in new projects and seriously consider replacing it with the new Zend_loader_Autoloader solution before the release of Zend Framework 2.0.
Using Zend_Loader is useful in some sense, but since the Zend Framework follows the infinitely predictable PEAR convention, the following works just as well and skips Zend_Loader's more expensive sanity operations.
function __autoload($path) {include str_replace('_','/index.html',$path) . '/zendframeworkbook/en/10/.html';return $path;}
You could also create this as a static method for your Bootstrap class.
class ZFExt_Bootstrap{// ...public static function autoload($path){include str_replace('_','/index.html',$path) . '/zendframeworkbook/en/10/.html';return $path;}// ...}
A four line function versus a class. Who won between David and Goliath again? Notably, some third party libraries will need special treatment if not following the PEAR convention.
With Zend Framework 1.8 and later, there is a new solution in Zend_Loader_Autoloader whose features are worth adopting even if it appears more complex than the simple autoload replacement I just described. Despite the new class' complexity, you can still have your performance cake and eat by applying a simple change to how Zend_Loader_Autoload::autoload() operates. This is possible since the new class allows developers to add replace the default autoloader, which by default is Zend_Loader::loadClass(), with a lighter version to avoid all the often unnecessary file checks. You should note that if you are using Zend_Application, this must be done prior to bootstrapping which means in index.php.
$autoloader = Zend_Loader_Autoloader::getInstance();$autoloader->setDefaultAutoloader(array('ZFExt_Bootstrap', 'autoload'));
Using autoloading will not prevent the impact of all those require_once statements in the Zend Framework source code by itself. To maximise the benefit of autoloading, it's not a bad idea to simply delete the require_once references from all the class files. You can accomplish this in a Phing task, or via the command line, or any old PHP script you can run on a new Zend Framework library copy.
From the command line you can comment out those references using:
cd path/to/ZendFramework/library

find . -name '/zendframeworkbook/en/10/.html' -not -wholename '/zendframeworkbook/en/10//Loader/Autoloader.html' -print0 | \
  xargs -0 sed --regexp-extended --in-place 's/(require_once)/\/\/ \1/g'
Within the framework there are a few classes which indulge in expensive operations. For example Zend_Db_Table runs a DESCRIBE TABLE query in the background everytime you create a new instance of its type. Considering you could be using at least a few of these in every request, these additional queries mount up. Another example is Zend_Translate which will continually reparse translation sources when utilised.
Luckily both of these components allow you to define a cache, so to avoid feeling very foolish in the future be sure to set them up.
For Zend_Db_Table, you can set a default cache by passing an instance of Zend_Cache to Zend_Db_Table_Abstract::setDefaultMetadataCache(). Zend_Translate offers the same feature using Zend_Translate::setCache(), as does Zend_Locale using Zend_Locale::setCache(). These can be configured and entered into your bootstrap so they are available for all requests.
In performance optimisation, caching is a big deal since it can mean deliver substantial performance gains by caching the results of expensive operations for a period of time. However, knowing when to cache also raises the question of where to cache.
Take the example of a dymanic page where the dynamic elements (perhaps an hourly updated list of the most recent news) change infrequently. The most obvious target is to cache the dynamic data for the most recent news (within a Model or View Helper perhaps). Since it's hourly, the cache TTL will be around 3,600 seconds. Now, the dynamic elements are only updated from new data on the hour. However, to utilise this cache we need to call the application to trigger the View generation which utilises the cache - every request still hits the application as normal.
Is this really necessary? If the only dynamic elements on the page update hourly, then why not cache the entire page for the full hour? You can perform page caching from your Bootstrap using Zend_Cache.
<?phpclass ZFExt_Bootstrap{// ...public function run(){$this->setupEnvironment();/*** Implement Page Caching At Bootstrap Level*/$this->usePageCache();$this->prepare();$response = self::$frontController->dispatch();$this->sendResponse($response);}public function usePageCache(){$frontendOptions = array('lifetime' => 3600,'default_options' => array(// disable default caching for all requests'cache' => false),// cache routes to Index and News controllers'regexps' => array('^/$' => array('cache' => true),'/zendframeworkbook/en/10//news/index.html' => array('cache' => true)));$cache = Zend_Cache::factory('Page','Apc',$frontendOptions);// serve cached page (if it exists) and exit$cache->start();}// ...}
But is even this level of caching sufficient? We still need to call PHP for the Bootstrap and perform at least a little work, and it likely uses an Apache process as a result. In fact, the fastest caching strategy is to cache these dynamic pages for up to an hour as static HTML files which don't need PHP and which, in a reverse proxy setup, can bypass Apache altogether and be served by a lighter alternative like lighttpd or nginx. Of course, since requests would never touches the application or the bootstrap - how to expire that cache gets a bit complex!
With or without physical static caching, a complementary practice would be to delegate caching to the client through the use of Etag and Last-Modifed headers. While helpful when you have a lot of repeat visitors, it's not as powerful as static HTML caching when unique or infrequent regular visitors are the norm.
This discussion illustrates that as we deploy caching across an application, it's important to identify where caching can be located to offer the greatest benefit. Remember that caching is all about avoiding unnecessary processing and memory usage - the closer caching moves to the outside layers of an application, the more processing it's likely to avoid.
In a typical Zend Framework application you can expect to find classes stuck all over place. It's not unusual to be pulling classes from so many locations that your final include_path looks a mess. This impacts performance since any time you include a class (whether directly or via an autoload function) using a relative path, PHP needs to hunt down a matching file by iterating over every include_path registered.
Since this is undesirable there are two simple rules to apply.
First, minimise your include paths. Where possible install libraries and even the Zend Framework into shared directories. Since many PHP5 libraries have long since adopted the PEAR Convention, this won't pose much difficulty. The exception will be pulling down library updates using, for example, svn:externals under Subversion, when the external library has files in it's parent location. An example of one such exception is HTMLPurifier which maintains files parallel with the HTMLPurifier directory.
But beyond these limited exceptions, keep libraries in one shared location where possible. Then instead of having ten million include path entries, you can keep a more efficient list of 2-4 locations at a maximum.
The second rule is to ensure that the most frequently required paths are at the front of the include path list. This ensures they are found quickly and iterating across the other possible locations is limited to the more rarely used classes.
No matter how aggressively you optimise your application, eventually your server will experience a limit as to how much traffic it can handle. One of the most important limiting factors on a server is the amount of memory it has available. As traffic to your application increases, more and more memory will be consumed by Apache processes and MySQL until finally the server is left with no alternative but to start using disk based swap space.
Swap space is incredibly slow (indeed all disk operations are snails compared to utilising RAM) and avoiding it as much as possible is desirable. Having Apache processes relying on swap space or worse, having the Apache parent process spawn children from swap, can bring your application stumbling to a crawl which will not result in a particularly great user experience. This is especially true of Ajax applications where a responsive UI is extremely important.
The most obvious solution to these server woes is simply to throw more hardware at the problem, a process called scaling. You could increase RAM or obtain a higher spec replacement server (vertical scaling) or employ multiple servers to handle the load (horizontal scaling). However, before you prematurely scale in either direction its still important to make the most efficient use of your available server resources to minimise expenditure on new hardware. Yes, optimisation does save you money as well as making your users happier.
In examining Apache, our HTTP server, there are a few areas that can be looked at. Apache's configuration file, a long standing mystery to many developers, is where a lot of memory management problems end up being created. The problem is that Apache quite likes its diet of RAM and isn't about to let any escape its grasp without a fight. The other problem is that Apache, while being a super successful fast server, has even nimbler competitors that require far less memory (heresy!).
A strategy where we both configure Apache to be as optimal as possible given the available server resources, and bypass it entirely when it is absolutely not needed, can lead to some dramatic improvements in performance. There are also two other factors, one which relates to letting clients cache content and another which is a side effect of the continuing march towards 64bit operating systems. Let's start with configuration before I find myself tied to a stake surrounded by burning timber and stern faced people with pitchforks.
The simple truth of Apache is that your server can only efficiently support the number of child processes your memory can accommodate. The classic misconfigured server allows for too many (or conversely too few) Apache children to run around uncontrolled, using so much memory that an encounter with swap space is inevitable. Reigning in the number of Apache child processes and keeping a lid on ever increasing memory consumption will keep your server running at maximum efficiency without completely digging itself into an early grave when the Digg Effect comes knocking.
Unfortunately, there is no one perfect Apache configuration. Some servers have more memory than others, or spend more time serving static files instead of dynamic content. Your configuration will need to be adjusted and tested (we mentioned Apache Bench and Siege earlier) depending on your own application's profile and server software. The pointers below are broad suggestions on where to look when starting out.
For memory management, the most important configuration options are StartServers, MinSpareServers, MaxSpareServers, MaxClients, and MaxRequestsPerChild. Since PHP likes prefork Apache, every request to the server requires a child process. Luckily, child processes are allowed to stick around and service multiple requests (less waiting around for new ones to spawn). Each child therefore spends time sitting around occupying a pile of memory. So in a nutshell, if your server memory (after accounting for other processes like MySQL, ssh, etc) has enough memory to let 40 Apache processes exist without hitting swap space (see MaxClients), then you should make sure you never have many more than that.
Calculating how many clients to allow is no easy proposition. The simple calculation is:
It may be a three second calculation, but Apache consumes memory differently for different scenarios. A simple Zend Framework request might consume 17-20MB per process (say 40 processes for a server with 1GB RAM, 800 of which is considered free for Apache). Serving a static or cached page would consume considerably less, 2-4MB per process. Adjusting Apache's configuration means having some judgement on how users are utilising the application, how often cached pages vs fully dynamic pages are requested, and what level of caching is employed (full or partial).
While monitoring memory usage (perhaps using a mix of top, free or the very nice htop) and doing some pounding with ApacheBench and siege, configure the above settings starting with some modest values (usually the default after installation). Based on the resulting memory usage level, you can start tweaking to allow for more or less total child processes (MaxClients) with varying starting positions (StartServers, MinSpareServers). MaxRequestsPerChild usually starts with quite a high value but you should be wary if child processes start growing in memory over time - keep the setting to a level that kills off child processes if they start inflating too much - its intent after all is to combat potential memory leaks. Make sure the ServerLimit configuration value stays ahead of MaxClients.
Here's a snapshot showing htop at work (a lot prettier than top with lots of interactive features).
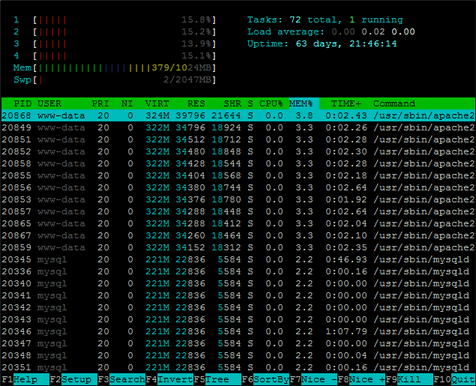
Server resource monitoring with htop
Other targets you should look at include KeepAlive and KeepAliveTimeout. Make sure they are enabled since they let clients reuse connections for multiple HTTP requests. Of course, if your client doesn't need to make a lot more requests, KeepAliveTimeout should move to a level that prevents connections staying alive for too long when they could be serving the other clients clamouring for attention. Starting with a KeepAliveTimeout of 2 is usually sufficient. Some websites with optimised HTML even do better when this is disabled or set to 1.
Next up is everyone's constant - .htaccess files. If you have control over your own Virtual Hosts, consider moving .htaccess directives into the appropriate Directory container of http.conf or the external vhosts file. That will cut out the continual .htaccess parsing Apache needs to do.
My final words are reserved for Apache's mod_expire module which controls Expire and Cache-Control HTTP headers. These headers tells clients to cache static content and not to bother requesting items until they have...expired! It's useful for images, CSS, javascript and other static content. Apache's configuration options for these can be set on a server, Virtual Host or Directory level making fine tuning possible. It's usefulness lies in cutting down the number of requests clients make - less requests means leaving memory and CPU cycles freer to serve others.
Here's an example influencing CSS files, it adds HTTP headers to expire files served from the given directory 30 days (2592000 seconds) after each of the files' modification (M) times.
<Directory /home/mrweb/public_html/example.com/css>
    ExpiresActive On
    ExpiresByType text/css M2592000
</Directory>
After optimisation, you might notice you still seem to be getting 35-40 requests per second with as many Apache processes as can fit in memory, but htop or free insist you have free RAM sitting idle even with Apache Bench ripping along. Unfortunately, sometimes your memory capacity far exceeds the ability of your CPU to keep up thus creating a bottleneck. There's really not much you can do in this scenario without investing in more CPU capacity except perhaps ensuring your application is optimised against over usage of the CPU. Caching obviously plays a part here. In similar situations, I do tend to start migrating from disk caches to memory caches (for example using APC or Memcached backends for Zend_Cache). Why not if there's free RAM to take advantage of? Memory caches are very fast, and can be used to cache the results of CPU intensive operations (even if the result is something tiny) to get that little extra out of the CPU.
Sometimes, you just need to go around Apache. Apache is fast but it uses a lot more memory, and can be slower, than a number of alternatives like Lighttpd and Nginx. In this section we'll take a look at using Nginx as a reverse proxy to Apache. This means that Nginx serves as the front line HTTP server proxying all requests for dynamic content to Apache in the background, but handling all static content itself. It also means that Apache sends any content to Nginx to serve, letting Apache move on to another request faster.
This approach offers a number of advantages. Nginx has a tiny memory footprint compared to Apache, so replacing any use of Apache with Nginx offers an immediate memory saving. This comes into the light when serving static content where Nginx is faster and lighter than using Apache. It's also of use where slow clients are common. Slow clients are those who take a longer than usual time to complete downloading requests. While the client is working, an Apache process is sitting on the server for any number of seconds waiting for the client to finish up. Would you prefer to have a 15MB+ process waiting for ages, or instead have Nginx with it's minimal footprint doing the waiting leaving the Apache process free to move to another dynamic content request? The answer should be obvious!
Staying with the Ubuntu theme of this book, installing Nginx is a simple:
sudo aptitude install nginx
You can omit sudo if running as root, but seriously why would you even have root accessible?
In configuring a reverse proxy setup, it becomes important to consider the role of both Nginx and Apache. Apache will no longer be listening on port 80 since Nginx will take over as the front end, so we should change Apache's configuration to instead listen on something like port 8080 by changing the main configuration file or, where used, ports.conf.
NameVirtualHost *:8080
Listen 8080

<IfModule mod_ssl.c>
    Listen 443
</IfModule>
We should also change any Virtual Host configurations to use port 8080 also.
<VirtualHost *:8080>
  ServerAdmin webmaster@example.com
  ServerName  example.com.com
  ServerAlias www.example.com
  DocumentRoot /var/www
</VirtualHost>
Moving on to Nginx, you employ a Ubuntu style configuration with a main configuration file, and sub-configurations for Virtual Hosts (Nginx servers). There's an element of duplication here since Nginx will often need a matching "server" configuration container for each Apache Virtual Host we want to use the reverse proxy setup. Here's a sample main configuration file stored at /etc/nginx/nginx.conf under Ubuntu.
# Ubuntu Intrepid

user                www-data www-data;
worker_processes    2;
error_log           /var/log/nginx/error.log warn;
pid                 /var/run/nginx.pid;

events {
    worker_connections  1024;
    use epoll;
}

http {
    server_names_hash_bucket_size 64;

    include             /etc/nginx/mime.types;
    default_type        application/octet-stream;

    log_format main '$remote_addr - $remote_user [$time_local] '
                    '"$request" $status $body_bytes_sent "$http_referer" '
                    '"$http_user_agent" "$http_x_forwarded_for"';

    access_log          /var/log/nginx/access.log;

    client_body_temp_path /var/spool/nginx-client-body 1 2;
    client_max_body_size 32m;
    client_body_buffer_size    128k;

    server_tokens       off;
    sendfile            on;
    tcp_nopush          on;
    tcp_nodelay         off;
    keepalive_timeout   2;

    # include per-server (Virtual Host) configurations for enabled sites
    include             /etc/nginx/sites-enabled/*;

}
Nginx tends to have a reputation for obscure configuration documentation since the original texts are all written in Russian. English translations are maintained at http://wiki.codemongers.com/. You won't find a MaxClients here, rather it's a factor of the values of worker_processes and worker_connections. The documentation covers the other options noted here and some will look familiar coming from Apache.
At the end of this configuration, or in a separate file at the specified /etc/nginx/sites-enabled/ directory you can create per-server configurations. These are akin to Apache Virtual Hosts configurations.
server {
    listen       80;
    server_name  example.com www.example.com;

    # Default Gzip Configuration (Set Exceptions Per Location)
    gzip on;
    gzip_comp_level 2;
    gzip_proxied any;
    gzip_types text/plain text/html text/css text/xml application/xml application/xml+rss \
        application/xml+atom text/javascript application/x-javascript application/javascript;

    # Handle Static Content Here
    location ~* ^.+\.(jpg|jpeg|gif|png|ico)$  {
        root    /var/www;
        access_log off;
        gzip off;
        expires 30d;
    }
    location ~* ^.+\.(css|js)$ {
        root    /var/www;
        access_log off;
        expires 1d;
    }
    location ~* ^.+\.(pdf|gz|bz2|exe|rar|zip|7z)$ {
        root    /var/www;
        gzip off;
    }

    # Proxy Non-Static Requests to Apache
    location / {
        # Proxy Configuration
        proxy_pass         http://your-servers-ip:8080/;
        proxy_redirect     off;

        proxy_set_header   Host             $host;
        proxy_set_header   X-Real-IP        $remote_addr;
        proxy_set_header   X-Forwarded-For  $proxy_add_x_forwarded_for;
        proxy_max_temp_file_size 0;

        client_max_body_size       10m;
        client_body_buffer_size    128k;

        proxy_connect_timeout      90;
        proxy_send_timeout         90;
        proxy_read_timeout         90;

        proxy_buffer_size          4k;
        proxy_buffers              4 32k;
        proxy_busy_buffers_size    64k;
        proxy_temp_file_write_size 64k;
    }
}
![[Caution]](/images/docbook/caution.png)
|
Caution |
|---|---|
|
Lines ending with \ indicate a single line that is wrapped here for readability and should be a single line in the actual configuration file. |
This server configuration is pointed to the same document root as out earlier Apache Virtual Host. Think of it as a filter and gateway. The very first part of the server configuration sets up content compression using gzip as default. I've added three location containers which apply a regular expression to intercept requests for specific file types. When detected, these will be served directly by Nginx without bothering Apache. Depending on the file type I've also told Nginx whether or not to gzip the content, and what Expires header to set (if any). These three containers ensure Apache need never spend expensive memory on static content Nginx can serve.
The final fourth location container effects everything the previous containers don't catch, which will be dynamic content and any static files Nginx's regular expressions don't match. Here we configure Nginx to forward the request to port 8080 of the local server IP where Apache is listening. Once Apache has finished the request, it's immediately sent back to Nginx (leaving Apache free for something else) to handle.
We've run the gamut of optimisation tips for Zend Framework applications and even touched on a few hardware concerns to boot. There are doubtless many other optimisation tips not mentioned here so it is, as you can see, a broad area.
The primary message threaded across the appendix is that optimisation requires measuring progress against a baseline performance benchmark and other metrics. It's only by applying a robust methodology that real opportunities for optimisation are identified and their potential gain judged. Wasting your time on random optimisations with minimal gain is something well worth avoiding.